Linux Dash is really light Weight real time web based performance monitoring tool for Linux Desktop & servers. It provides simple and powerful GUI with widgets. We can rearrange the Widgets as per our convenient, also you can do like drag and drop. Linux Dash will show server statistics such as CPU, RAM, Disk, Network & installed applications.
It consume 1MB on disk, Live graphs, refresh-able widgets, and a growing no of supported modules. Linux Dash supports PHP on Apache and Nginx, Node.js, Python, and Go.
1) Prerequisites for Linux Dash
I’m going ahead Linux Dash installation with Apache & php, so make sure you have to install LAMP before proceeding Linux Dash installation, alternatively you can go with LEMP.
2) Install Linux Dash
Just clone the Linux Dash files from GitHub Repository. Make sure you should clone on Apache public folder /var/www/html. It will automatically create folder called linux-dash after the github clone.
# cd /var/www/html
# git clone https://github.com/afaqurk/linux-dash.git
3) Secure Dashboard
Make sure you have to secure your dashboard from unauthorized user access by adding password. The Apache HTTP Server can use a .htpasswd file referenced from a .htaccess file to create restricted protected areas.
# htpasswd -c /var/www/html/linux-dash/.htpasswd 2g
.htpasswd is the standard file name that contains the encrypted format authentication credentials, and you can actually call it whatever you want as long as you reference it in the .htaccess file.
AuthUserFile /var/www/html/linux-dash/.htpasswd
AuthType Basic
AuthName "My restricted Area"
Require valid-user
4) Monitor Server Statistics from Linux-Dash
Open your browser and navigate to http://localhost/linux-dash, Enter the username and password which you created.
5) Linux-Dash Screen Shot Tour
For reference purpose, i have added few screen shot here.
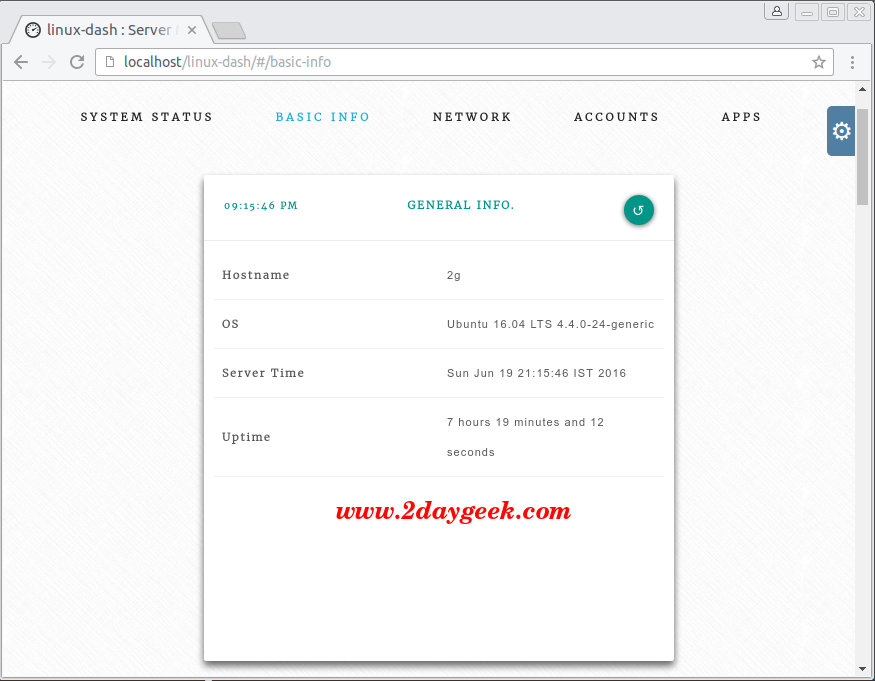
General Info
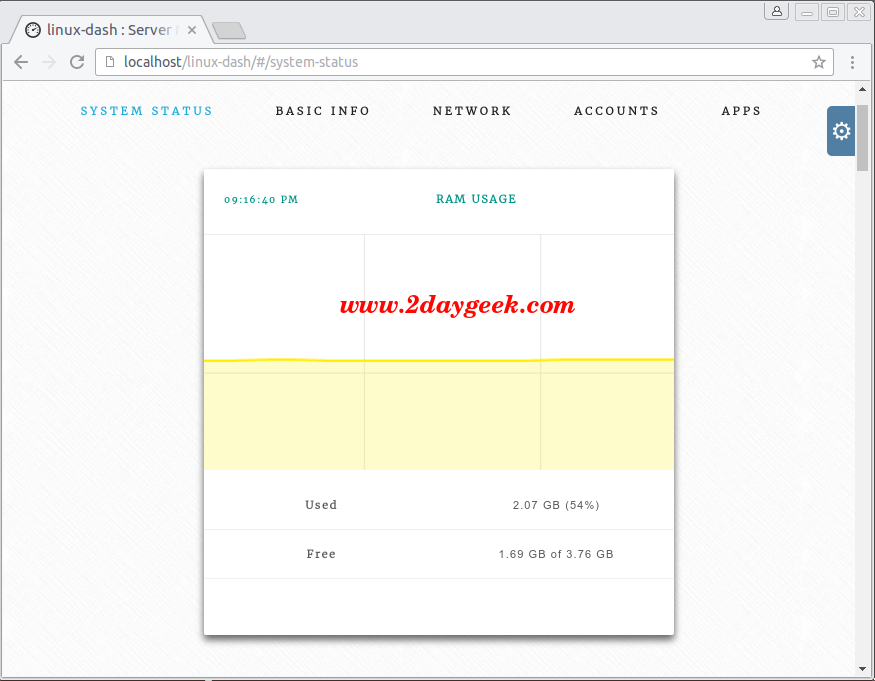
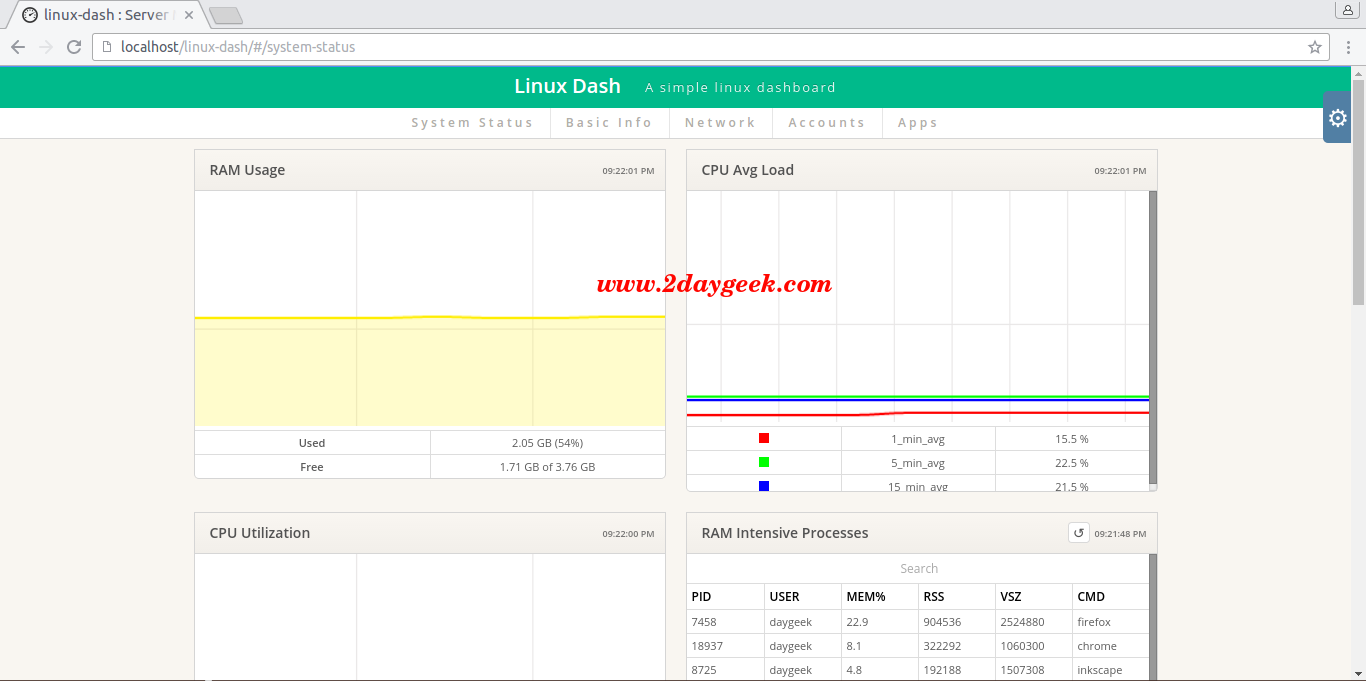
RAM Usage
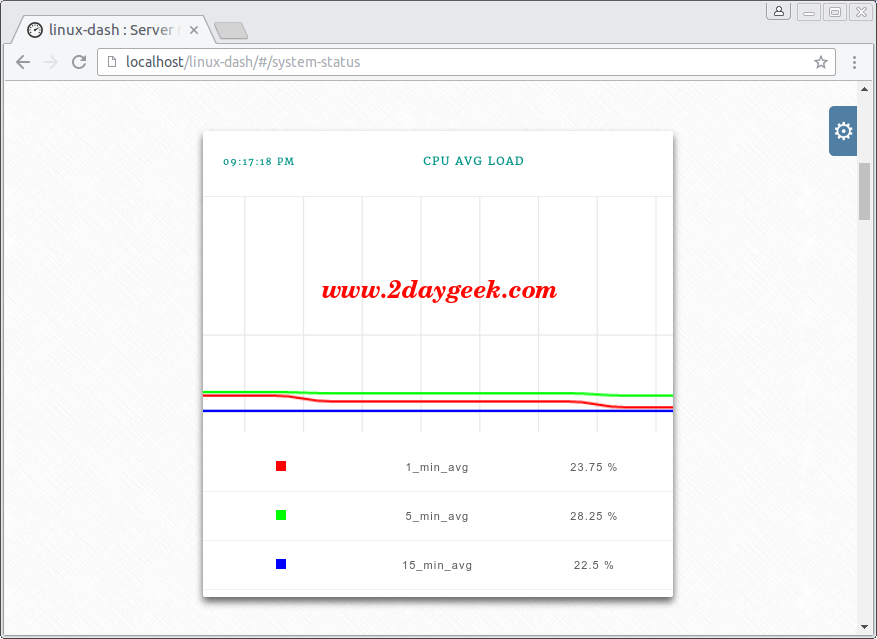
CPU Avg Usage
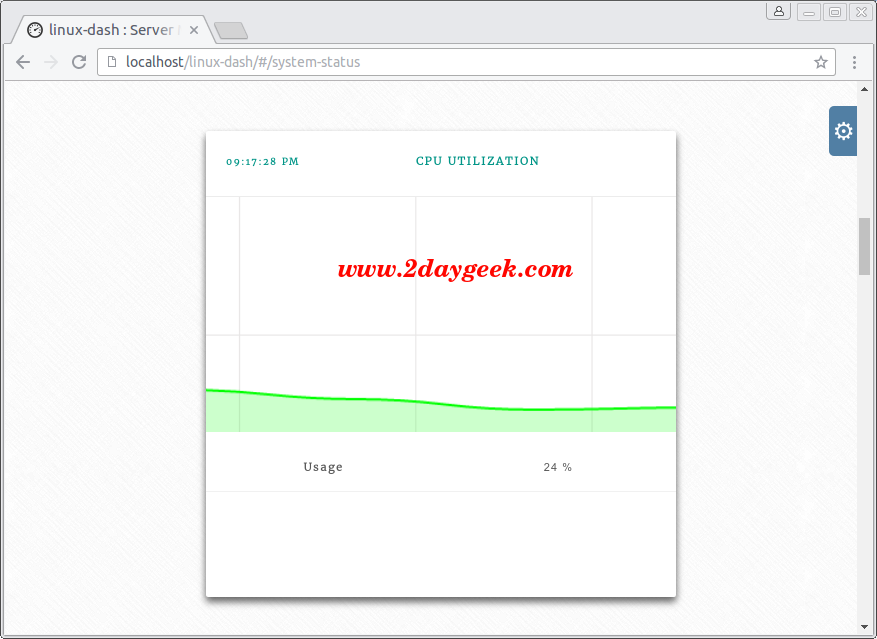
CPU Utilization
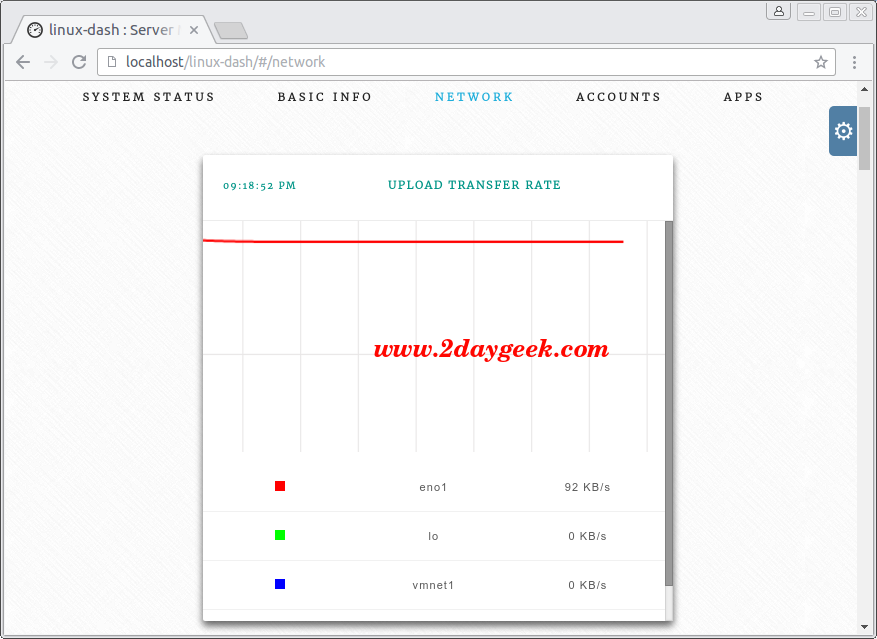
Bandwidth Usage
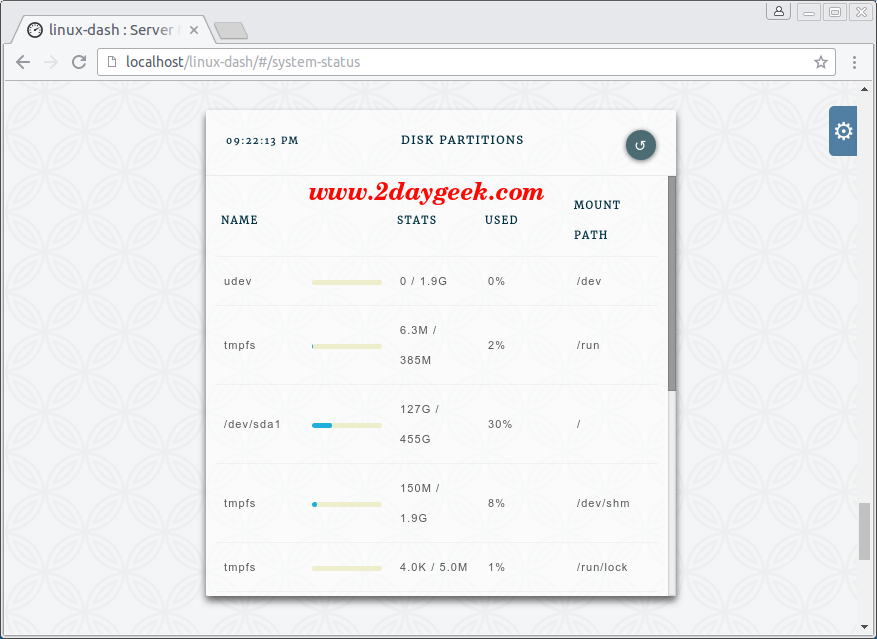
Disk Usage
Old dashboard
Enjoy…)


