Netdata is a real-time performance monitoring solution, which used to monitor all our systems and applications on Linux PCs, servers or embedded devices. Netdata written in C and is extremely lightweight with less than 1% CPU utilization of a single core. We have already covered many more Monitoring Tools that are capable to presenting statistics of past performance but netdata is designed to be perfect for real-time performance troubleshooting.
Netdata is a Linux daemon, which collects data in real time (per second) and presents a web site to view and analyze them. The presentation is also real-time and full of interactive charts that precisely render all collected values. Out of the box, it comes with plugins that collect key system metrics and metrics of popular applications.
Netdata has been designed to be installed on every Linux system, without disrupting the installed applications on it. It consume very less CPU (1 %) & memory (10-15 MB). It does not use any disk I/O while running except logging. Also it saves its DB to disk when it exits and loads it back when it starts.
Monitored by Netdata with ZERO configuration
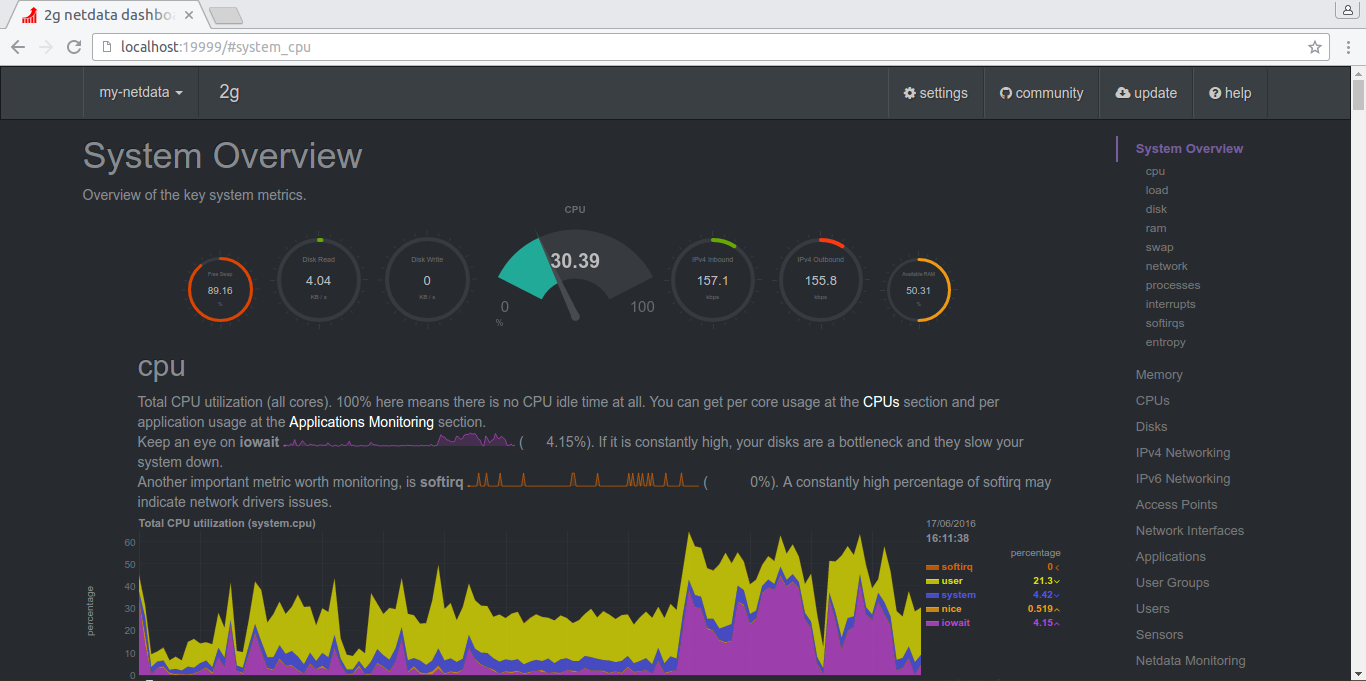
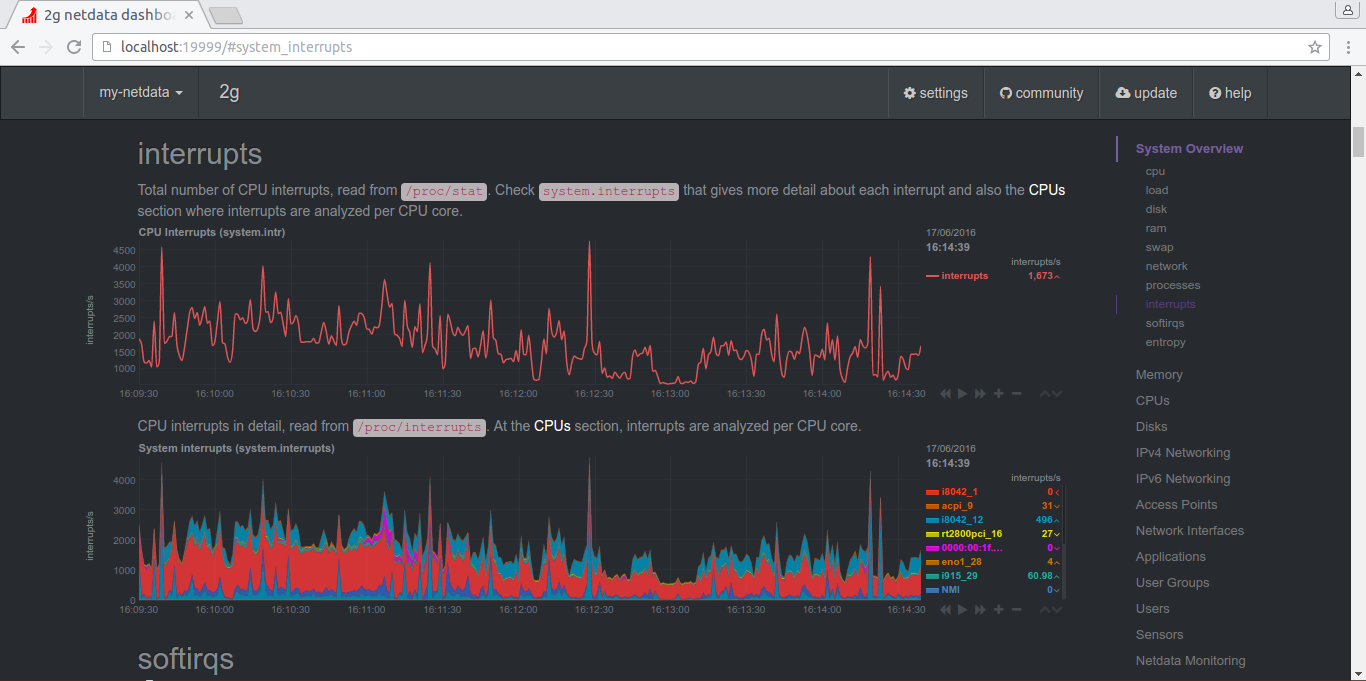
- CPU usage, interrupts, softirqs and frequency (total and per core)
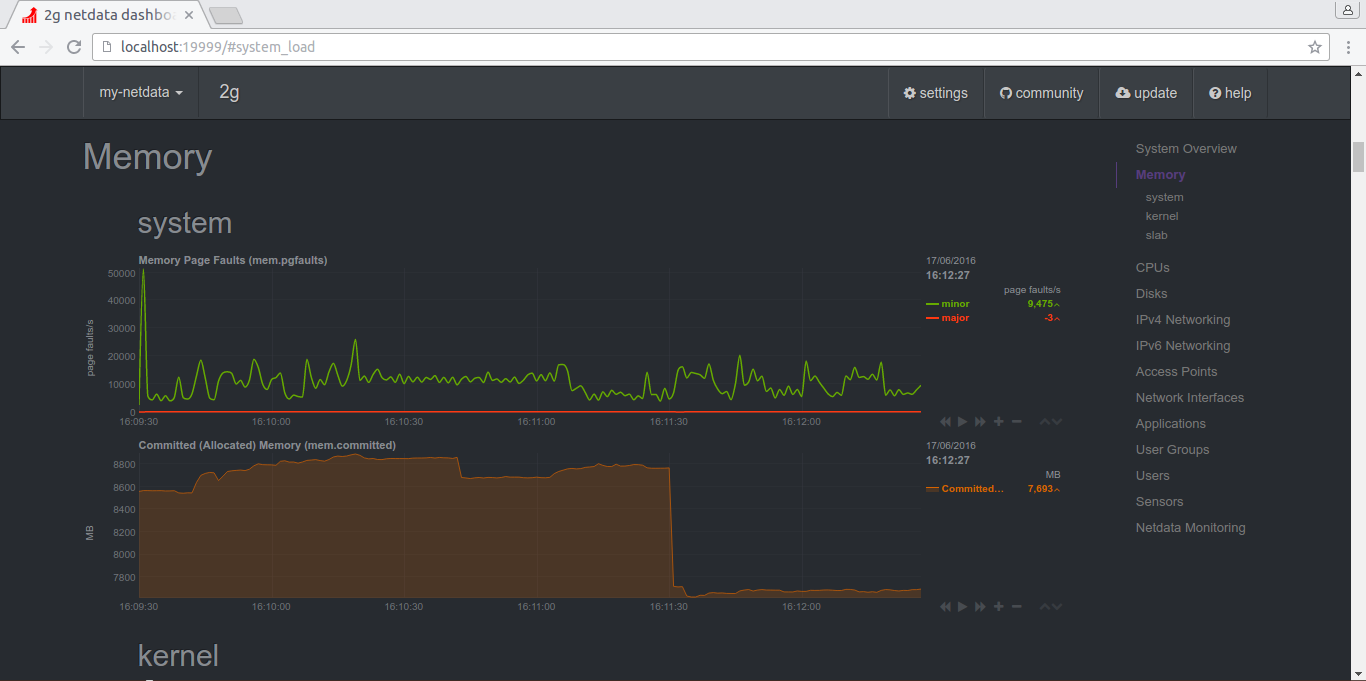
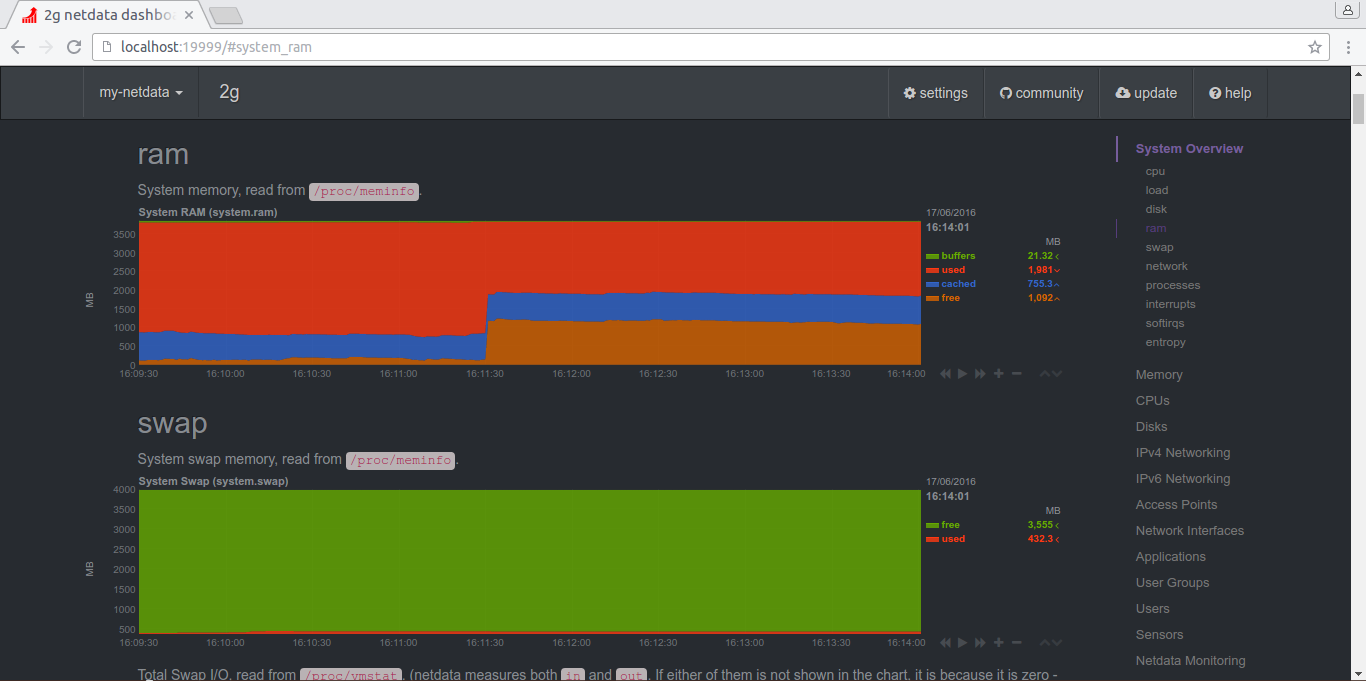
- RAM, swap and kernel memory usage (including KSM and kernel memory deduper)
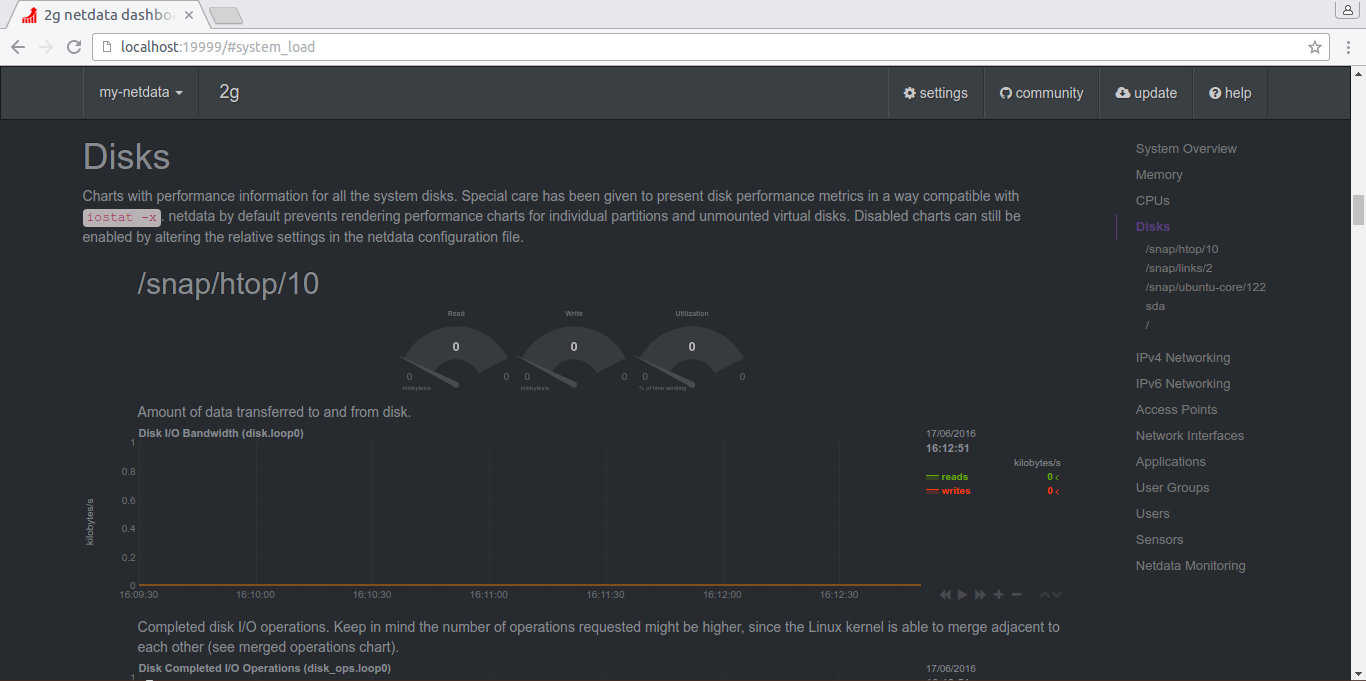
- Disks (per disk: I/O, operations, backlog, utilization, space, etc)
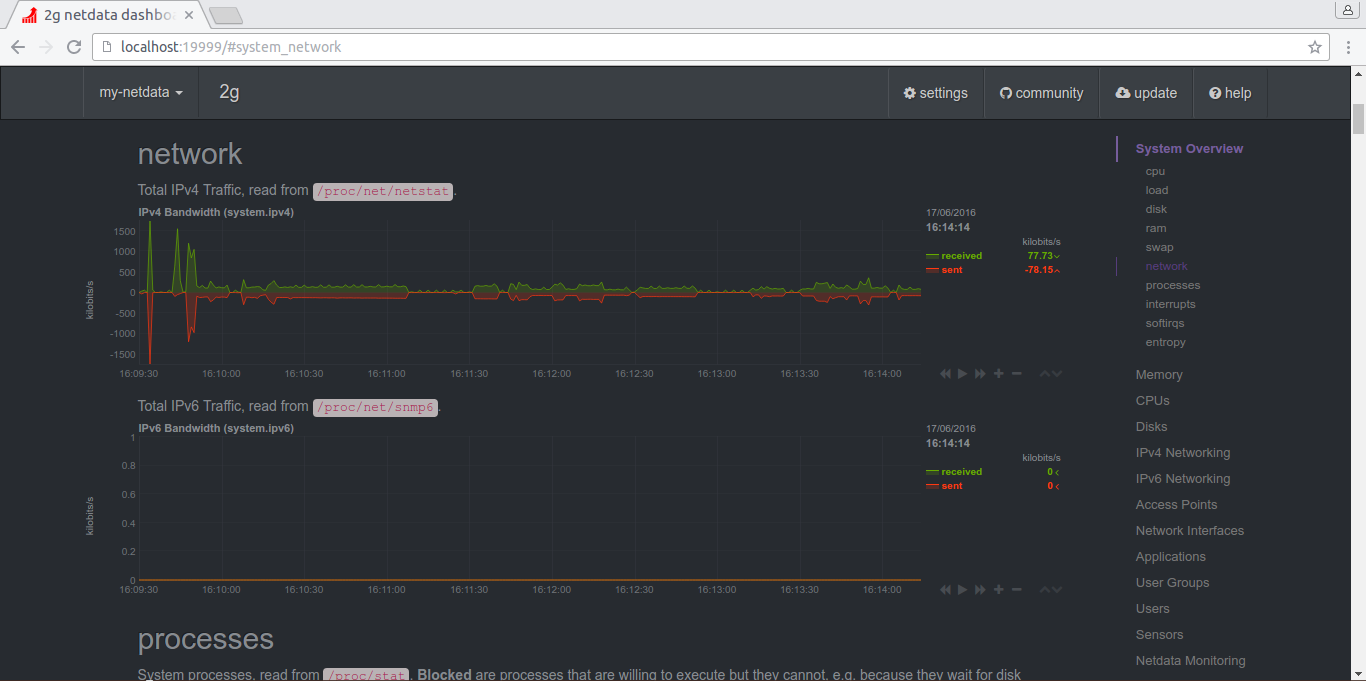
- Network interfaces (per interface: bandwidth, packets, errors, drops, etc)
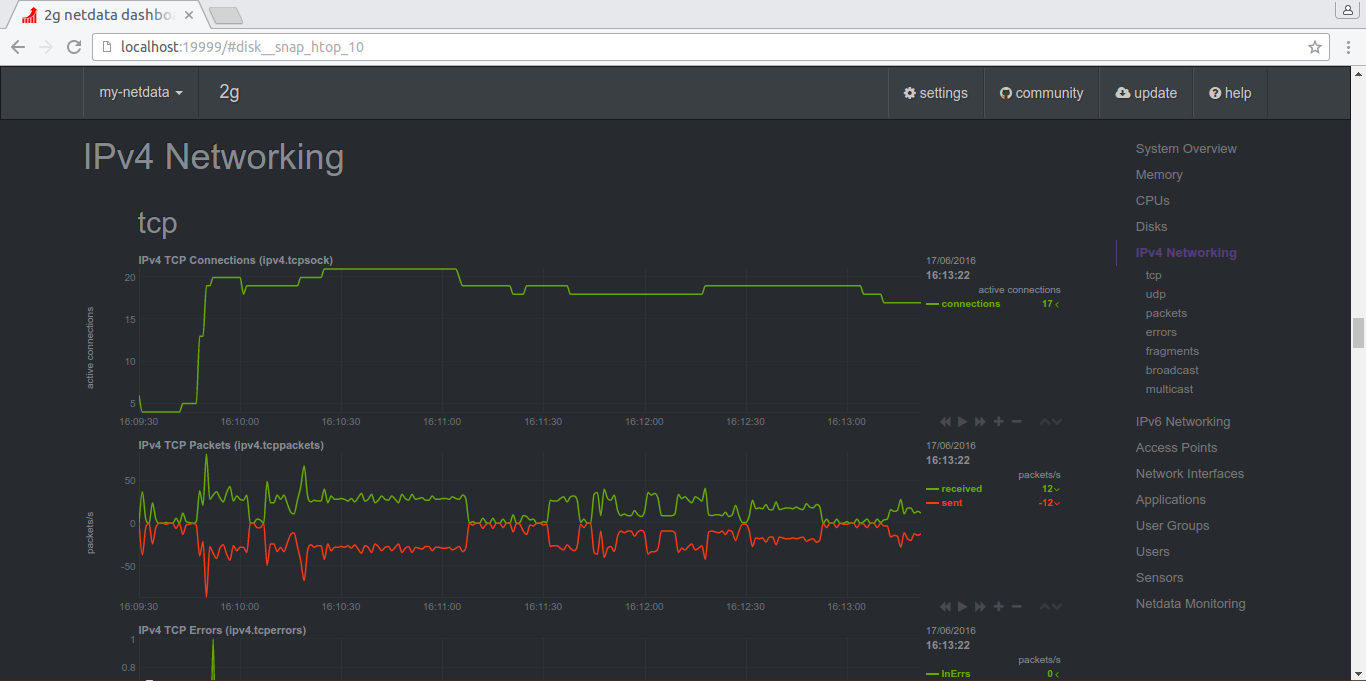
- IPv4 networking (bandwidth, packets, errors, fragments, tcp: connections, packets, errors, handshake, udp: packets, errors, broadcast: bandwidth, packets, multicast: bandwidth, packets)
- IPv6 networking (bandwidth, packets, errors, fragments, ECT, udp: packets, errors, udplite: packets, errors, broadcast: bandwidth, multicast: bandwidth, packets, icmp:
- messages, errors, echos, router, neighbor, MLDv2, group membership, break down by type)
- netfilter / iptables Linux firewall (connections, connection tracker events, errors, etc)
- Linux DDoS protection (SYNPROXY metrics)
- Processes (running, blocked, forks, active, etc)
- Entropy (random numbers pool, using in cryptography)
- NFS file servers, v2, v3, v4 (I/O, cache, read ahead, RPC calls)
- Network QoS (yes, the only tool that visualizes network tc classes in realtime)
- Linux Control Groups (containers), systemd, lxc, docker, etc
- Applications, by grouping the process tree (CPU, memory, disk reads, disk writes, swap, threads, pipes, sockets, etc)
- Users and User Groups resource usage, by summarizing the process tree per user and group (CPU, memory, disk reads, disk writes, swap, threads, pipes, sockets, etc)
- Apache web server mod-status (v2.2, v2.4)
- Nginx web server stub-status
- mySQL databases (multiple servers, each showing: bandwidth, queries/s, handlers, locks, issues, tmp operations, connections, binlog metrics, threads, innodb metrics, etc)
- ISC Bind name server (multiple servers, each showing: clients, requests, queries, updates, failures and several per view metrics)
- Postfix email server message queue (entries, size)
- Squid proxy server (clients bandwidth and requests, servers bandwidth and requests)
- Hardware sensors (temperature, voltage, fans, power, humidity, etc)
- NUT UPSes (load, charge, battery voltage, temperature, utility metrics, output metrics)
- Tomcat (accesses, threads, free memory, volume)
- PHP-FPM (multiple instances, each reporting connections, requests, performance)
- SNMP devices can be monitored too (although you will need to configure these)
Netdata will work all the major Linux Distribution such as Gentoo, Arch Linux, Ubuntu, Debian, CentOS, Fedora, RHEL, SUSE, openSUSE, Alpine Linux & PLD Linux.
1) prerequisites for Netdata
Make sure you have to install below prerequisites packages before proceed Netdata installation on your system.
On Debian/Ubuntu
$ sudo apt-get install zlib1g-dev uuid-dev libmnl-dev gcc make git autoconf autogen automake pkg-config curl jq nodejs
On Centos/Fedora/Redhat
[RHEL/CentOS/up to Fedora 21]
# yum install zlib-devel libuuid-devel libmnl-devel gcc make git autoconf autogen automake pkgconfig curl jq nodejs

[Fedora 22 later]
# dnf install zlib-devel libuuid-devel libmnl-devel gcc make git autoconf autogen automake pkgconfig curl jq nodejs
2) Install Netdata
Just clone the netdata files from git at opt which will automatically create netdata directory, then navigate to directory and run the netdata-installer.sh file that’s it.
# cd /opt
# git clone https://github.com/firehol/netdata.git --depth=1
# cd netdata
./netdata-installer.sh
Once the installer completes, the file /etc/netdata/netdata.conf will be created.
Netdata added into Arch Linux/Manjaro system official repository, they can simply install by running below command.
$ sudo pacman -Syu netdata
Start & Stop Netdata.
# /usr/sbin/netdata

# killall netdata
3) Access Netdata
Netdata will listen with Port Number 19999 make sure you have to allow the port number on firewall level. To access the web site for all graphs http://127.0.0.1:19999/. You can get the running config file at any time, by accessing
http://127.0.0.1:19999/netdata.conf
4) Update Netdata to Latest Version
You can update netdata to the latest version by navigating downloaded directory /opt/netdata.
# cd /path/to/git/downloaded/netdata
# git pull
# ./netdata-installer.sh
5) Uninstall Netdata
You can easily uninstall netdata by navigating downloaded directory /opt/netdata. The uninstaller will ask you to confirm all deletions.
# cd /path/to/git/downloaded/netdata
# ./netdata-uninstaller.sh --force
6) Netdata Screen Shot Tour
I have included few Screen Shot for reference purpose.
