Apache is one of the famous web server, which is currently serving more than 100 million websites.
As of August 2018, it was estimated to serve 39% of all active websites and 35% of the top million websites.
Do you know how to monitor Apache web server performance in Linux? It can be done through mod_status module and we will explain in details.
You can check Apache current connections using below article.
If no, don’t worry and you are in the right page to get the details.
What’s Apache?
The Apache HTTP web Server is free and open-source cross-platform web server software. It’s widely used web server software.
Developed and maintained by Apache Software Foundation. It is fast, reliable, and secure web server. It can be highly customized to meet the needs of many different environments by using extensions and modules.
What’s mod_status module?
The Status module allows a server administrator to find out how well their server is performing.
A HTML page is presented that gives the current server statistics in an easily human readable form. If required this page can be made to automatically refresh in certain duration.
Basically it shows, web server details such as Server Version, Serve Build date & time, Server Uptime, total accesses in number (How many request served this duration), total traffic (Bandwidth usage), CPU usage for web server activity, how many request per sec, how many requests currently being processed & idle workers.
If you already had installed any hosting control panel like cPanel, Plesk, etc.., Then you can easily check the Apache server performance in the control panel GUI.
The Apache mod_status module shows following information.
- How many worker request is currently processing and how many worker process is idle.
- The status of each worker, the number of requests that worker has performed and the total number of bytes served by the worker
- A total number of accesses and byte count served
- Web server restarted time, current time and how login it has been running.
- Server build date and time
- Total traffic and CPU load
- Averages giving the number of requests per second, the number of bytes served per second and the average number of bytes per request
- The current percentage CPU used by each worker and in total by Apache
- The current hosts and requests being processed
How to Enable Apache mod_status Module in Linux?
By default the mod_status module has installed on Apache but it’s not enabled.
For Ubuntu & Debian systems the Apache config file is located at /etc/apache2/apache2.conf & CentOS, RHEL & Fedora systems the Apache config file is located at /etc/httpd/conf/httpd.conf.
To do so, just find the “mod_status” word in the config file then un-comment it.
For Red Hat based systems.
# vi /etc/httpd/conf/httpd.conf

LoadModule status_module modules/mod_status.so
For Debian based systems.
# ls -lh /etc/apache2/mods-enabled | grep status.conf

lrwxrwxrwx 1 root root 29 Mar 17  2019 status.conf -> ../mods-available/status.conf
Also, the mod_status module parameters are commented out in Apache config file. To enable this, just un-comment the below code in your Apache config file.
For Apache 2.2 Version
<Location /server-status>
    SetHandler server-status
    Order deny,allow
    Deny from all
    Allow from localhost
</Location>
For Apache 2.4 Version
<Location "/server-status">
    SetHandler server-status
    Require host localhost
</Location>
Save and close the file then restart the Apache web server service.
Use the below commands to restart the Apache (httpd) server in Linux.
For SysVinit Systems – openSUSE & Debian based systems.
# service apache2 restart
or
# /etc/init.d/apache2 restart
For SysVinit Systems – RHEL (RedHat) based systems.
# service httpd restart
or
# /etc/init.d/httpd restart
For systemd Systems – openSUSE & Debian based systems.
# systemctl restart apache2.service
or
# systemctl restart apache2
For systemd Systems – RHEL (RedHat) based systems.
# systemctl restart httpd
or
# systemctl restart httpd.service
How to Access Apache mod_status Module?
Everything is done and you are ready to monitor Apache web server performance.
It can be done in two ways either Web Browser or Linux Terminal.
To access this through web browser, just launch your preferred web browser and access it.
http://serveripaddress/server-status

or

http://serev-hostname/server-status
To access this from Linux terminal, just launch your terminal and run the following command to access it.
# elinks http://localhost/server-status
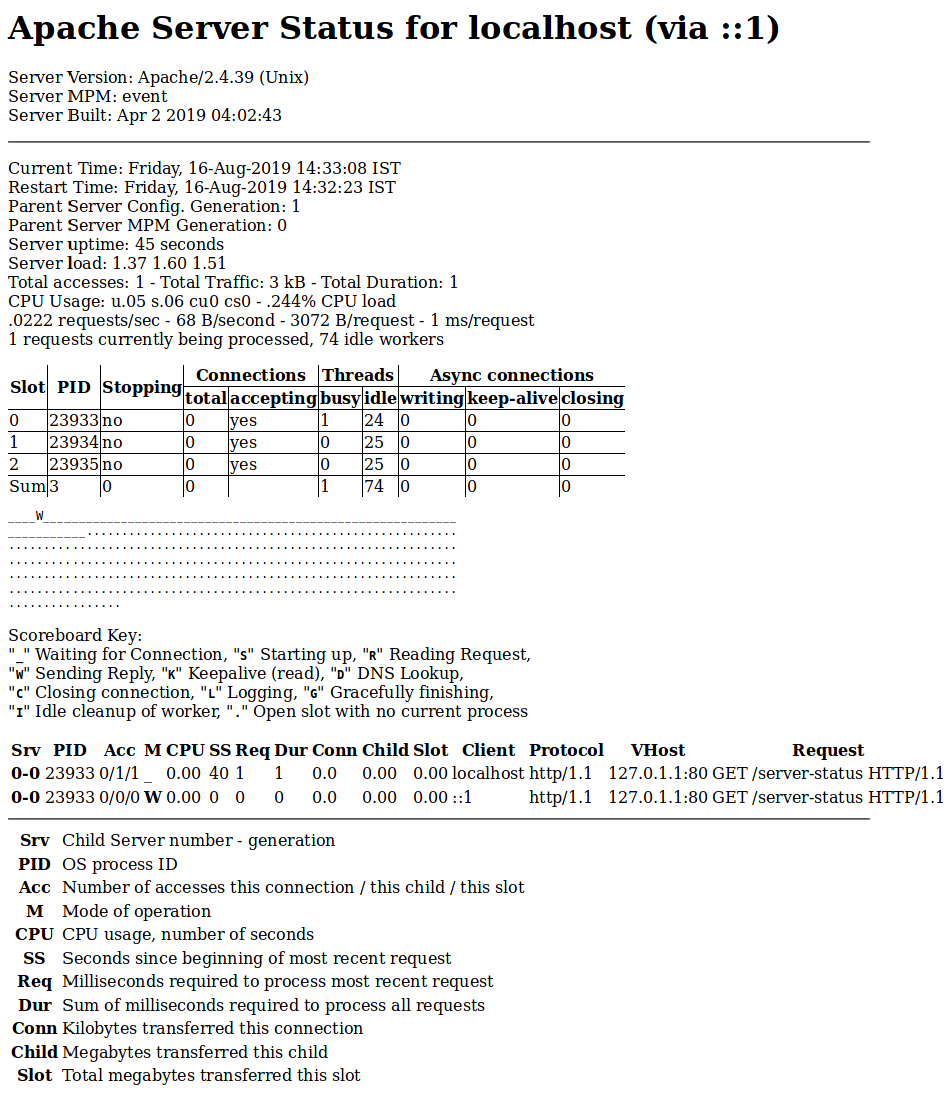
Apache Server Status for localhost (via ::1)
Server Version: Apache/2.4.39 (Unix)
Server MPM: event
Server Built: Apr 2 2019 04:02:43
-----------------------------------------------------------------------------------------------------
Current Time: Friday, 16-Aug-2019 14:37:21 IST
Restart Time: Friday, 16-Aug-2019 14:32:23 IST
Parent Server Config. Generation: 1
Parent Server MPM Generation: 0
Server uptime: 4 minutes 57 seconds
Server load: 1.34 1.48 1.47
Total accesses: 5 - Total Traffic: 17 kB - Total Duration: 5
CPU Usage: u.05 s.09 cu0 cs0 - .0471% CPU load
.0168 requests/sec - 58 B/second - 3481 B/request - 1 ms/request
1 requests currently being processed, 74 idle workers
+--------------------------------------------------------------------------------------------+
| | | | Connections | Threads | Async connections |
| Slot | PID | Stopping |-------------------+-------------+--------------------------------|
| | | | total | accepting | busy | idle | writing | keep-alive | closing |
|------+-------+----------+-------+-----------+------+------+---------+------------+---------|
| 0 | 23933 | no | 0 | yes | 0 | 25 | 0 | 0 | 0 |
|------+-------+----------+-------+-----------+------+------+---------+------------+---------|
| 1 | 23934 | no | 0 | yes | 1 | 24 | 0 | 0 | 0 |
|------+-------+----------+-------+-----------+------+------+---------+------------+---------|
| 2 | 23935 | no | 0 | yes | 0 | 25 | 0 | 0 | 0 |
|------+-------+----------+-------+-----------+------+------+---------+------------+---------|
| Sum | 3 | 0 | 0 | | 1 | 74 | 0 | 0 | 0 |
+--------------------------------------------------------------------------------------------+
____________________________W___________________________________
___________.....................................................
................................................................
................................................................
................................................................
................................................................
................
Scoreboard Key:
"_" Waiting for Connection, "S" Starting up, "R" Reading Request,
"W" Sending Reply, "K" Keepalive (read), "D" DNS Lookup,
"C" Closing connection, "L" Logging, "G" Gracefully finishing,
"I" Idle cleanup of worker, "." Open slot with no current process
Srv PID Acc M CPU SS Req Dur Conn Child Slot Client Protocol VHost Request
0-0 23933 0/1/1 _ 0.00 293 1 1 0.0 0.00 0.00 localhost http/1.1 127.0.1.1:80 GET /server-status
HTTP/1.1
0-0 23933 0/1/1 _ 0.00 252 0 0 0.0 0.00 0.00 localhost http/1.1 127.0.1.1:80 GET /server-status
HTTP/1.1
0-0 23933 0/1/1 _ 0.01 252 0 0 0.0 0.00 0.00 localhost http/1.1 127.0.1.1:80 GET /favicon.ico
HTTP/1.1
1-0 23934 0/1/1 _ 0.01 116 1 1 0.0 0.00 0.00 localhost http/1.1 127.0.1.1:80 GET /server-status
HTTP/1.1
1-0 23934 0/0/0 W 0.00 0 0 0 0.0 0.00 0.00 ::1 http/1.1 127.0.1.1:80 GET /server-status
HTTP/1.1
2-0 23935 0/1/1 _ 0.00 93 2 2 0.0 0.00 0.00 localhost http/1.1 127.0.1.1:80 GET /server-status
HTTP/1.1
-----------------------------------------------------------------------------------------------------
Srv Child Server number - generation
PID OS process ID
Acc Number of accesses this connection / this child / this slot
M Mode of operation
CPU CPU usage, number of seconds
SS Seconds since beginning of most recent request
Req Milliseconds required to process most recent request
Dur Sum of milliseconds required to process all requests
Conn Kilobytes transferred this connection
Child Megabytes transferred this child
Slot Total megabytes transferred this slot
How to Access Apache mod_status Module with Automatic Update?
You can get the status page to update itself automatically in certain duration.
Here the page refresh every 5 seconds, you can change the seconds based on your requirements.
From Web Browser.
http://serveripaddress/server-status?refresh=5

or

http://serev-hostname/server-status?refresh=5
From Linux Terminal.
# elinks http://localhost/server-status?refresh=5